How health care and insurance companies could leverage patient data for their insights to partner customers for preventive healthcare, dynamic premium pricing and combined physical therapy – a case study with diabetes data set.
About Author- Pranshu Tiwari is working as Managing Consultant in IBM India (Digital Strategy Team) and has authored more than 15 Papers which are in different stages of Patent Process. His research focus includes Business Analytics and Data Science in HealthCare & Utility Sector. His interest includes Business Analytics, Data Science,Digital Transformation & Enterprise IT strategy,Business Case Development for New initiatves . he is currently working for a client in US.
Abstract— This paper aims to create a predictive model which could be used by different Health Agencies to help them make informed intelligent data driven decisions on business/customer strategy .Understanding Customers and their health needs would help them to optimize their prospective business strategy. In this paper we take medical health care records as basic data points to give them intelligent insights to help them right target campaigns including Reduced Premiums, need for alternative Medication therapy , and groups to target for advanced or combined therapies. The research paper uses parametric model using Logistic Regression to identifying these cases. In particular this paper simulates a data for identifying poor Diabetes Care patients, Good Control Points from actual Sample Data. This paper uses data Set from University of California Irvine. (Note- There have been many papers who have used the pima indian diabetes dataset)
I. INTRODUCTION
Diabetes is a chronic disease that occurs either when the pancreas does not produce enough insulin or when the body cannot effectively use the insulin it produces leading to serious damage to many of the body’s systems, especially the nerves and blood vessel. The number of people with diabetes has risen from 108 million in 1980 to 422 million in 20141.
The global prevalence of diabetes among adults over 18 years of age has risen from 4.7% in 1980 to 8.5% in 20141. Diabetes is a major cause of blindness, kidney failure, heart attacks, stroke and lower limb amputation1. While individual treatments is available for diabetes, insights from large chuck of data helps in prevention & identify people with high risk factors for Diabetes. At the same time diabetes can be prevented by lifestyle changes which will help in improving insulin sensitivity there by preventing Diabetes. Prediabetes means that your blood sugar level is higher than normal but not yet high enough to be classified as type 2 diabetes. Without intervention, prediabetes is likely to become type 2 diabetes in 10 years or less.2 Mayoclinic also states that certain lifestyle changes including eating healthy foods, getting more physical activity &loosing excess pounds can treat or even change they can reverse their condition. Hence to identify patients who are at risk of diabetes – this paper would like to explore and identify different markers of diabetes and identify the following
- Identify the markers of disease
- Create a model leverage early detection of Diabetes /increase predictability of diabetes
- Identify similarities in patients who have good sugar control as compared to other diabetic patients
II. APPROACH
The paper took University of California raw dataset and worked on the following steps to create a mathematical model:
A. Cleaning & Parsing of Data
The dataset had 0 biological values in certain fields like Diastolic Pressure, BMI, Triceps Thickness, and Serum Insulin. Hence we needed to remove Outliers by considering 0 values as NA.0 values were replaced by NA and were later deleted to create a consistent dataset Creation of Grooups based on Diabetes & Non Diabetes
B. Creating Classification Type
The data set had two classification 0(Non Diabetic) and 1(Diabetic). In addition another classification was added called Prediabetes based on Plasma Glucose Level in Blood. In addition- factors were created for Independent variable BMI to bring about versatility in the model
C. Creating Logistic Model
Logistic Regression was used to measure the relationship between “Classification” dependent variable and Independent variable. Since the dependent variable has a binary value the conditional distribution y ∣ x {\displaystyle y\mid x} is a Bernoulli distribution rather than a Gaussian distribution and hence we predicted the probability of classification Outcomes.




D. Creation of Third Classification Dependent Variable – Prediabetes
PreDiabetes or Borderline Cases are the ones who have Fasting Glucose More than 100 but less than 140 and PP more than 140 & Glucose less than 200. Hence as part of further analysis a new group of data classification was created called as Prediabetes
E. Multinomial Logistic Regression
Log function was used to measure the probability of Odds of one state over the base state /Normal Subjects.
Assuming there are three outcomes- Normal, Suspects & Diseased denoted by N,S & D then y3=log probability of suspects/Probability/(normal)
It helped in analyze the outcome of multi-way categorical dependent variable.
F. Roc & Operating Curves
ROC analysis provides tools to select possibly optimal models and to discard suboptimal ones independently from (and prior to specifying) the cost context or the class distribution
G. Validation Testing
Validation testing is done to ensure the accuracy of the model on test dataset and to ensure the it does not overfit the model. Test dataset is used by sampling and is 25% of Training Dataset
III. DATA SUMMARY & EXPLANATORY ANALYSIS
In particular, all patients in the database are females atleast 21 years old of Pima Indian heritage which consist of 768 instances of data. There are 8 class of numeric attributes covering
1. Number of times pregnant 2. Plasma glucose concentration a 2 hours in an oral glucose tolerance test 3. Diastolic blood pressure (mm Hg) 4. Triceps skin fold thickness (mm) 5. 2-Hour serum insulin (mu U/ml) 6. Body mass index (weight in kg/(height in m)^2) 7. Diabetes pedigree function 8. Age (years) 9. Class variable (0 or 1)
Data Summary.- All the data entities are continuous function and numeric in nature. The classification data is a binary logical variable 0 & 1 for Non-Diabetics & Diabetics
Table 1: Summary Data
The dataset was further divided in another variable called Pre-Diabetes for further analysis.
Table 2: Summary Data with additional Parameter
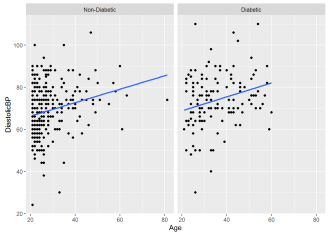
Initial findings suggest that Glucose PP& Diastolic Pressure increases with age irrespective of Normal or Diabetic Group. However average Diastolic BP or Sugar is higher in Diabetic Group as compared to Non Diabetic Group.
Figure 1a-Comparison on Glucose in two groups
Figure 1b- Diastolic Pressure across ages for two groups
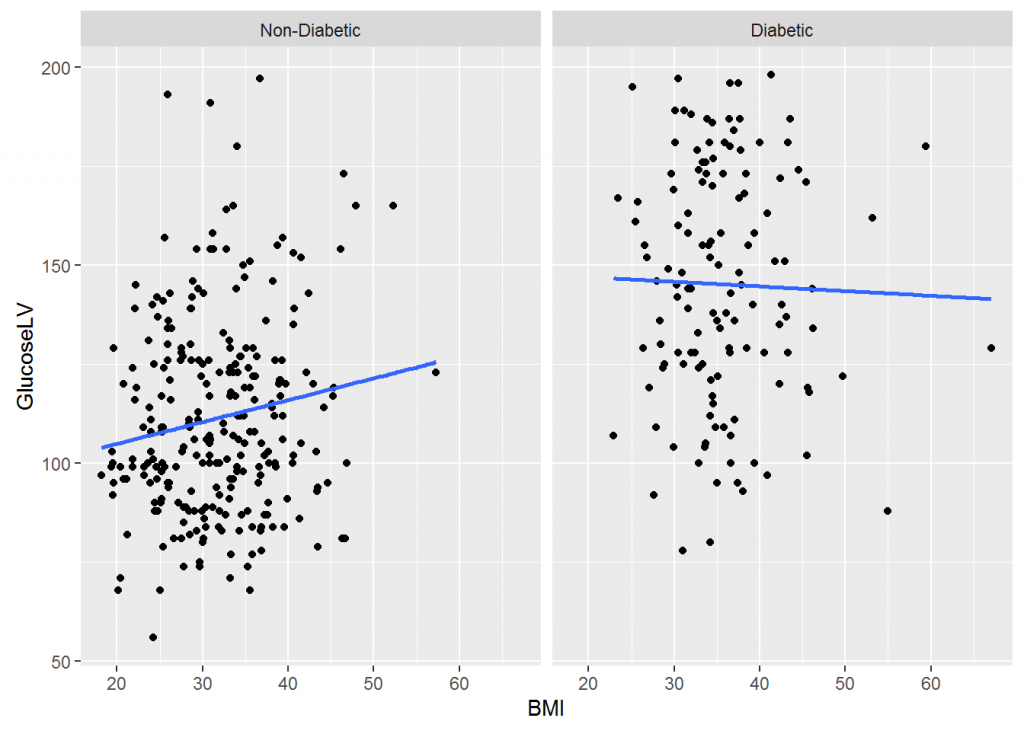
BMI is lower for Non-Diabetic Group than Diabetic Group leading to direct correlation on PP Glucose level of individuals
Figure 1c-Glucose LV across BMI in two groups
IV. SIMULATION
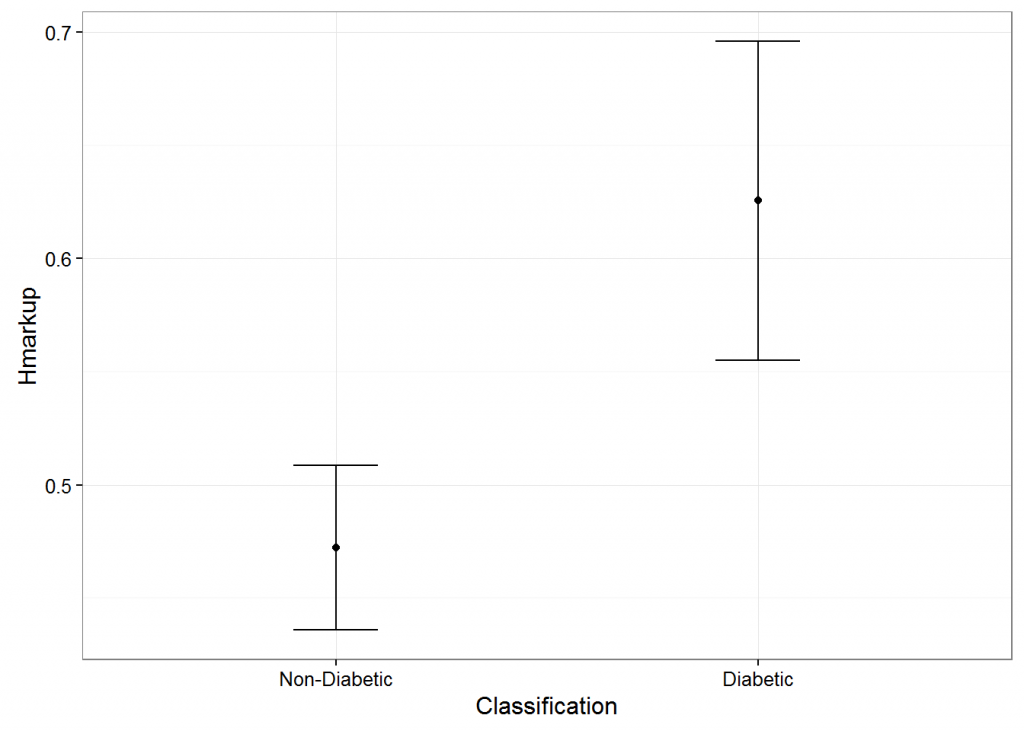
It is evident from Figure 1,2,3,4 that subjects with diabetes had higher BMI, Hmark up, Triceps Thickness and Age
A. Comparion of variation of independent variable in diabetic & non diabetic group
Created interval estimate for 95 % confidence Level for various key Dependent variables like BMI, Diastolic Pressure, Age, Triceps Thickness, Hereditary Mark up.
Figure2- Mean Age & Variation in two Groups
Figure 3 Comparison on Mean BMI among two different groups
Figure 5 Comparison of Hereditary mark up two groups
Figure 6 Comparison of Triceps Thickness among two groups
It is fairly evident that the mean of the four average parameters & their variations with 95% confidence interval was higher in Diabetic Group than Non-Diabetic Group
B. Models and machine learning
Predictive Analytics is used to extract the information from Pima.Indian.Diabetes to predict clinical outcomes based on past data. The objective of the model is to assess the likelihood that a similar patient with similar biological variables in a different sample will exhibit the specific Clinical Outcome.
Model 1- All independent variables are continuous except BMI. Age & Hereditary Markup is not considered as Dependent Variable
The following Dependent variables were considered
- Factor (BMI)
- Diastolic BP
- Triceps Thickness
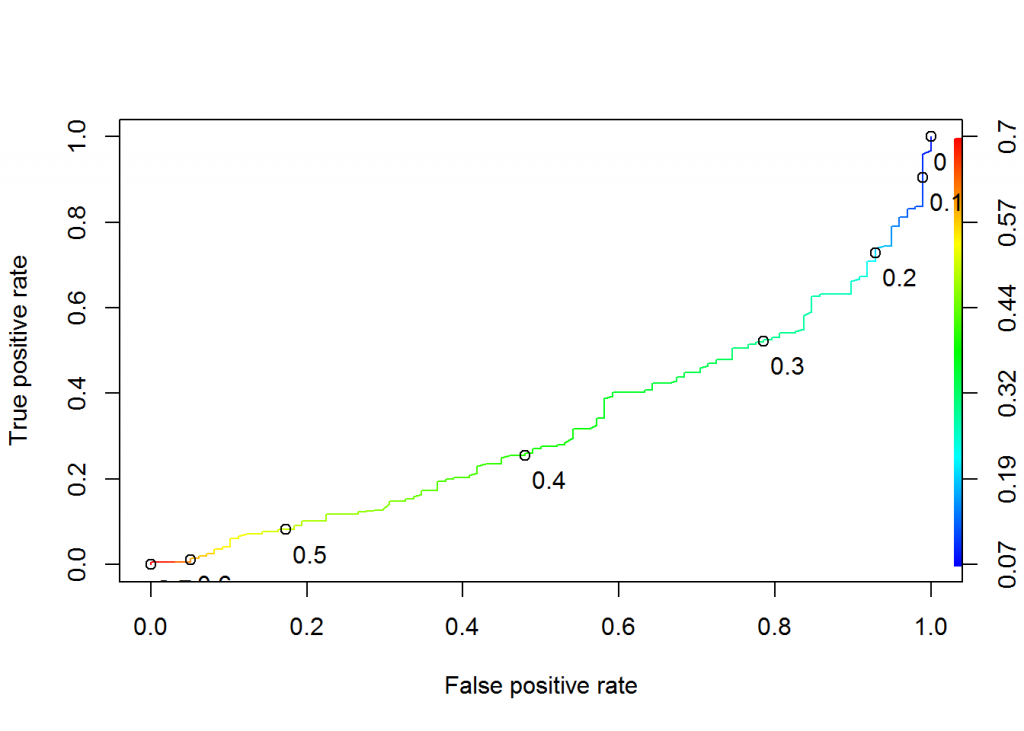
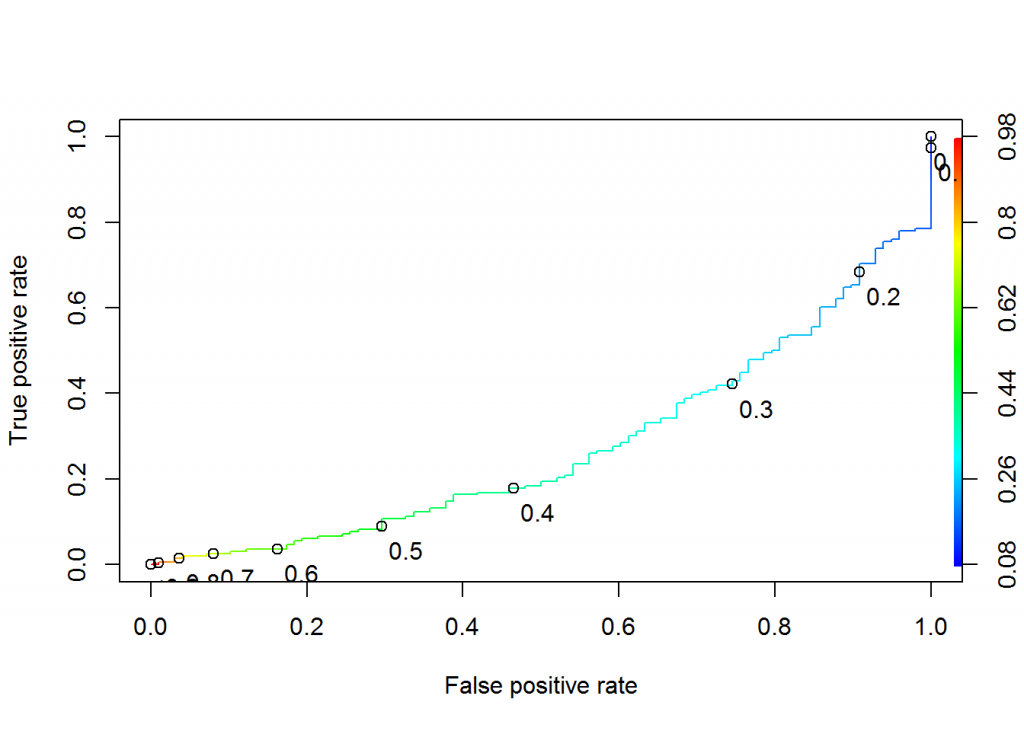
Sensitivity & Specificity of Model under various t values
Sensitivity refers to the test’s ability to correctly detect patients who do have diabetes while specificity relates to the test’s ability to correctly detect patients without a condition.
Figure 7.1 –ROC curve Model 1
At t value: 0.1 Insurance Companies could play safe and assign the lowest premium for following candidates
| Actual Outcome | Predicted No Diabetes /False | Predicted Diabetes /True |
| No Diabetes | 41 | 155 |
| Diabetes | 5 | 93 |
| Actual Outcome | Predicted No Diabetes /False | Predicted Diabetes /True |
| No Diabetes | 24 | 172 |
| Diabetes | 2 | 96 |
Model 2: All the above independent variable are continuous which includes, Diastolic BP, BMI & Triceps Thickness.
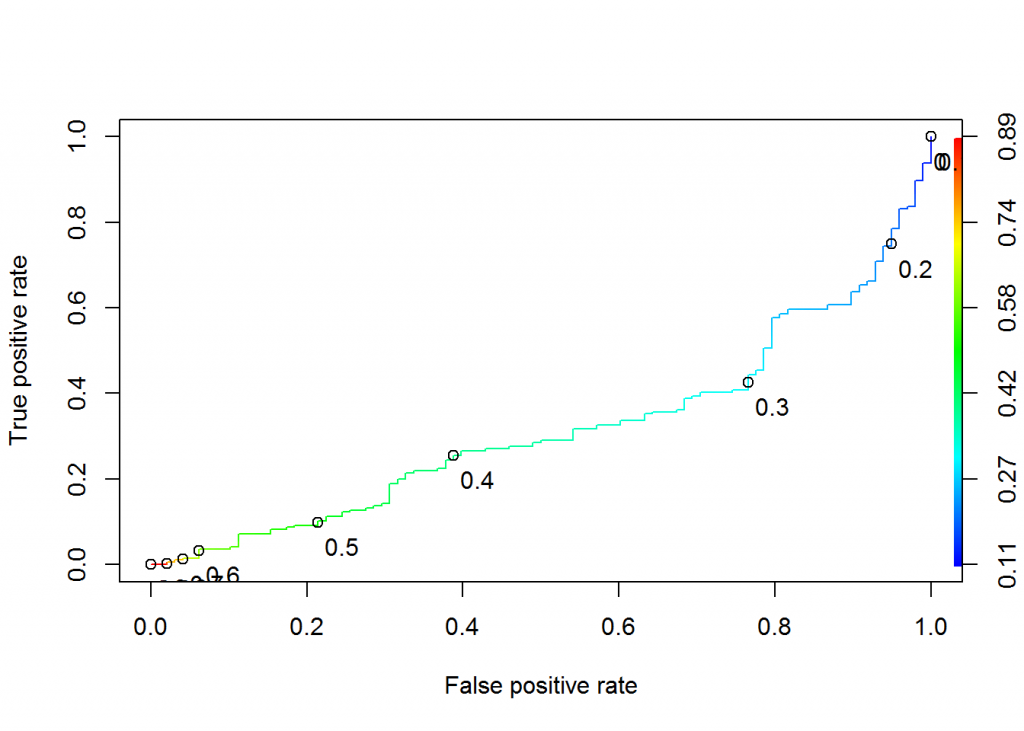
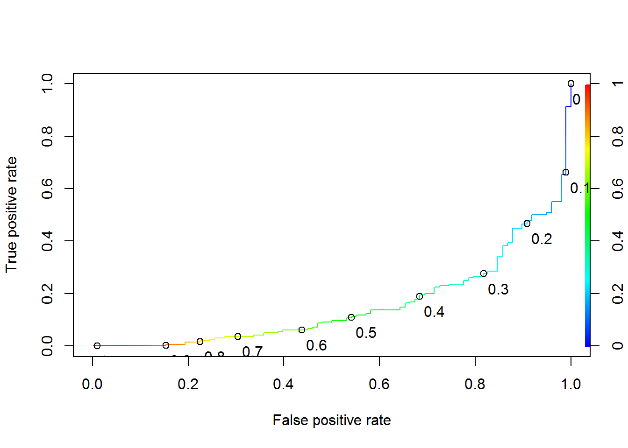
ROC curve- Sensitivity & Specificity of Model 2.
Figure 7.2 ROC Curve for Model 2
Model 3 Considers continuous independent variables including BMI, Hmark up, Triceps Thickness & Diastolic Pressure
Model 3 considers predicting diabetes by including Hereditary Markup, BMI, Triceps thickness & Diastolic Pressure.
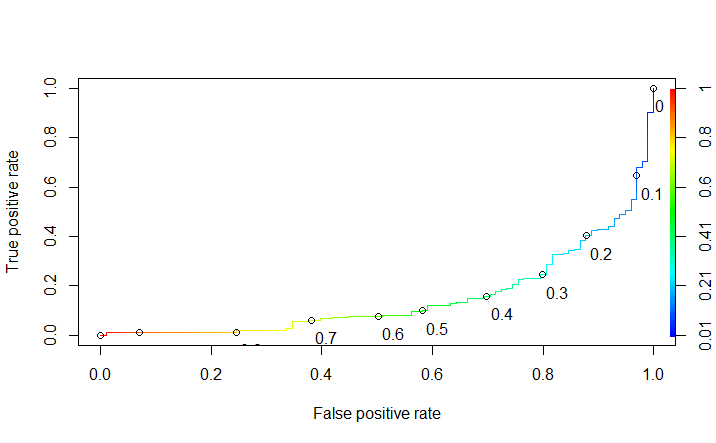
At t=0.16 we have 100% sensitivity with average specificity.
Hence at this point insurance company can ensure they are 100% safe in predicting diabetes without impacting customers.
This model does not consider interactions.
| Actual Outcome | Predicted No Diabetes /False | Predicted Diabetes /True |
| No Diabetes | 42 | 154 |
| Diabetes | 0 | 98 |
ROC curve – Sensitivity & Specificity
Figure 7.3 ROC curve Model 3
Model 4: Outcome considers Age, BMI, HMarkup,Diastolic Pressure,Triceps Thickness & their interactions
Considering Interactions among independent variables with Hereditary Markup, BMI, Triceps thickness, age Diastolic Pressure. –The model could predict at t=0.15 the following
| Actual Outcome | Predicted No Diabetes /False | Predicted Diabetes /True |
| No Diabetes | 89 | 169 |
| Diabetes | 1 | 97 |
Figure 7.4roc curve model4 : senstivity & specifitcuty
Model 5: Model considers independent variable viz. Hereditary Markup, BMI, Triceps thickness & their interactions
Considering Interactions among independent variables with Hereditary Markup, BMI, Triceps thickness,–The model could predict at t=0.15 the following
| Actual Outcome | Predicted No Diabetes /False | Predicted Diabetes /True |
| No Diabetes | 35 | 161 |
| Diabetes | 1 | 97 |
ROC curve – Sensitivity & Specificity
Model 6 – Considers Last Known Glucose Testing along with other Parameters Triceps Thickness, Hmark up, Age & BMI
| Actual Outcome | Predicted No Diabetes /False | Predicted Diabetes /True |
| No Diabetes | 177 | 19 |
| Diabetes | 41 | 57 |
Figure 7.6 roc curve model 6
Model 7: Multinomial Regression with 3 output variable – Normal, Pre-Diabetes, and Diabetes
All patients in data set whose PP glucose is between 140 & 200 and have not yet been classified as Diabetes have been considered as suffering from Pre-Diabetes. The model considered BMI, Age & Hereditary Mark up in Multinomial Regression
| Actual | Predicted Normal | Predicted Pre-Diabetes | Predicted Diabetes |
| Normal | 198 | 0 | 29 |
| PreDiabetes | 21 | 0 | 14 |
| Diabetes | 29 | 0 | 65 |
Leveraging MultiLogit and Neural networks about 198/227 are predicted Normal among Normal Patients and 65/94 are predicted Diabetic in Diabetic Group.
Hence overall Model 3 and Multinomial Logistic Regression is able to predict with reasonable accuracy Diabetic Patients among the group.
V. ANALYSIS & VALIDATION TESTING
Based on the ROC curves and Confusion Matrix Model 3 has highest Sensitivity with modest specificity. Hence firms could predict diabetes without their actual classification based on predictive model.
The model was run against test data to consider the efficacy of success of prediction. The model considered Diastolic BP, BMI & TricepsThickness. Hmark Up. Leveraging the model the prediction was able to predict 100% diabetes with about 48 cases being false Positive.
Validation Testing of Model 3 on Test Data Set
| Actual Outcome | Predicted No Diabetes /False | Predicted Diabetes /True |
| No Diabetes | 18 | 48 |
| Diabetes | 0 | 32 |
Model 3 also observed strong ROC curve for Test Data
VI. RECOMMENDATION
The model based on Predictive Analytics can be leveraged by various Health care companies to identify the members most likely to get Diabetes and determine the optimal message and channel of communication to connect these members with the appropriate premium and message to those systems. Predictive Analytics coupled with preventative interventions will improve the health of the highest-risk patients while reducing the cost. In this context following specific models could be potentially used to improve healthcare & cost associated to health casre.
- Insurance Companies could use the model 3 with t value 0.15 to identify patients who should have low insurance premium/least suspected patients. This is because the model has highest Sensitivity with a modest specificity as compared to other models. Hence the model will identify subject with less false positive without impacting any True Negative. Insurance Companies could leverage the model to help them identify low premium patients and hence higher market share to compete with other competitors in the ecosystem
- Hospitals and health Care companies who wants to target new Diabetic Medicine for high risk group or new Diabetic Campaigns should ensure that campaigns should not target False Positives . They should target patients with critical care and risk. Hence they should use Model 6 with t=0.4 to target definite & High Risk Diabetic patients. This is because model 6 identifies low false positive and hence will identify the worst patients in True Positive group. This is because worst /critical diabetes patients based on this model will help in finding patients who have any significant impact on existing pharmacological treatment
- Model 7 is recommended to be used by Healthcare Agencies to identify schemes/plan for Suspects. (Pre-Diabetics who are suspected to be Diabetics). This is because this model identifies Pre-Diabetics which have biological markups similar to Diabetic Patients and hence are high risk suspects
VII. FUTURE PROOFING & WAYFORWARD
The model will help healthcare providers to create new campaigns for patients who are most likely to get diseases (in this case diabetes). This will help healthcare companies move from traditional curative medicine to actionable preventive health care and help in partnering customers to manage their heath in manageable cost. Insurance companies could increase their market share by utilizing the data to provide right premiums for their customers for a win-win deal and provide cutting edge prices for their customers.
VIII.CHALLENGES
There are numerous challenges to the application and use of analytics, namely the lack of data standards, barriers to the collection of high-quality data, and a shortage of qualified personnel to conduct such analyses. Developed markets are little ahead in maturity curve and hence Technology companies should focus on integrating data and analytics while developing markets should focus on standardization of data and creating platforms to share and collaborate patient data as a foundation to health analytcs