Tweeter analysis on tweets for adidas & nike using rest api for 1500 tweets and compare the difference in positivism and check using 2 sample t test if difference is significant for entire population based on sample tweets

Twitter Analytics on Comparison of Positive Perception for top 2 sport brand companies –Adidas & Nike (Author: Pranshu Tiwari)
Both Brands Adidas and Nike are considered top two brands across the globe. Since I usually buy Adidas Product for tennis apparels (including shoes) and sometimes think of buying Nike Apparels for other sports-I wanted to examine tweets recent 2 weeks tweets on ’#%23adidas OR #%23Nike ” –to understand which brand has better perception index, which brand has higher proportion of positive tweets and finally check if in general positive tweets are lengthier than normal tweets. REST API was used to extract the recent tweets. In order to go ahead with analysis ,a pattern of words were created and was pre-defined as a list and then check the occurrence of these words in tweets. My project does NOT cover depth of positivity among tweets and hence any mention of positive words would identity the tweet as positive tweet. The project would help digital marketing team for respective retailers /retail brands know their brand perception as compared to other competitors.
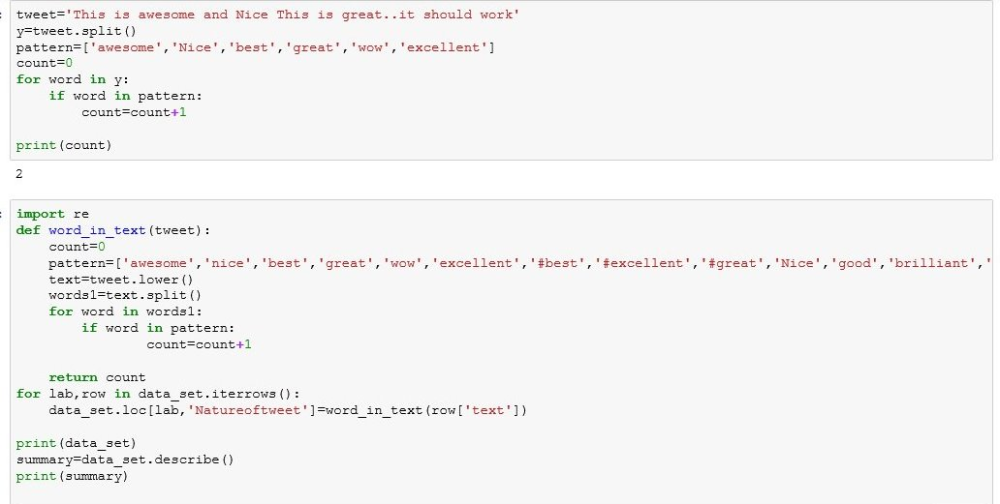
Pattern of words included but not limited to: great, excellent, good etc. (Please refer the Program in Python for details) .This will help to identify which brands has higher proportion of Positive tweets. About 1500 tweets were examined to calculate the perception index of two brands. The patter of words were examined for each tweet text and pattern of words were counted per tweet text. Since tweets need to be analyzed we first cleaned up the data by removing tweets which had not mentioned either of brands or script was not able to detect either the brand or tweets which mentioned both the brands. Similarly count of positive words > 1 in tweet were categorized to 1 (to create a nominal variable where zero tweets refer as normal tweet and count>=1 is referred as positive tweet). Please refer Python scripts for details for details.
The dataset was cleaned as we had to create two independent sample sets for conducting t-tests to check if we can difference in mean or count of positive tweets from the sample is significant enough to make an implication on the entire population. Since sample is independent ,random and sample size more than 30- we choose t-test for normality.
Gathering of tweets using tweepy API serach


Results
Positive Perception Index was calculated as sum of Occurrences of Positive Pattern words/ Company specific tweets. The bar plot (in Figure 1) shows the perception score of two brands. Adidas brand had a mean score of 0.08 while Nike had a score of 0.06. A two sample t test suggest that difference in mean score is not significant as p value was equal to 0.3168 >>p=0.05 meaning that both brands have similar positive perception index Please refer table 1 for details of test. Similarly test of proportion was done to detect the ratio of positive tweets on brand /number of tweets of brand. The two sample test of proportions also indicated that there was not much significant difference on two brands. The p value of the proportion test is about 0.2942 > 0.05 indicating that difference is not significant. Please refer table 2 for details .Hence our tweet analysis shows that both brands are nearly equal in positive perception and in line with our hypothesis.
Finally wanted to check if positive tweets are lengthier than normal tweets. The boxplot (Figure 2) shows that positive tweets are longer than normal tweets. Then two sample test verified that there is significant difference in length of two categories tweets as p value of test was 3.973893e-09<<0.05. Hence positive tweets are generally longer than normal tweets. Please refer Table 3 for two sample t-test for details.
Statistical Details

Figure 1 –Index score (Based on Positive tweets)

Figure 2 –Box Plot of Length of Tweets(agnostic to brand)
Two Sample t-test to check & compare difference in scores
## Welch two sample t-test
## data: AdidasScore and NikeScore
## t = 1.0015, df = 1484.8, p-value = 0.3168
## alternative hypothesis: true difference in means is not equal to 0
## 95 percent confidence interval:
## -0.01276574 0.03939679
## sample estimates:
## mean of x mean of y
## 0.07750953 0.06419401
Table 1(Above): Two sample t test comparing mean scores
Test to check Propotions-if there is higher proption of postive tweets of one brand as compared to other
## 2-sample test for equality of proportions with continuity
## correction
##
## data: c(42, 33) out of c(671, 686)
## X-squared = 1.1003, df = 1, p-value = 0.2942
## alternative hypothesis: two.sided
## 95 percent confidence interval:
## -0.01132374 0.04030012
## sample estimates:
## prop 1 prop 2
## 0.06259314 0.04810496
Table 2 (Above): Two sample t-test proportion of tweets of one brand as compared to other
Test to check if Positive tweets are longer than normal tweets
## Welch Two Sample t-test
## data: DatasetR4$CharCount[which(DatasetR4$Natureoftweet == 0)] and DatasetR4$CharCount[which(DatasetR4$Natureoftweet > 0)]
## t = -6.1904, df = 179.43, p-value = 3.974e-09
## alternative hypothesis: true difference in means is not equal to 0
## 95 percent confidence interval:
## -10.01860 -5.17532
## sample estimates:
## mean of x mean of y
## 119.5957 127.19
Table 3 (Above): Two sample t-test check if Posit